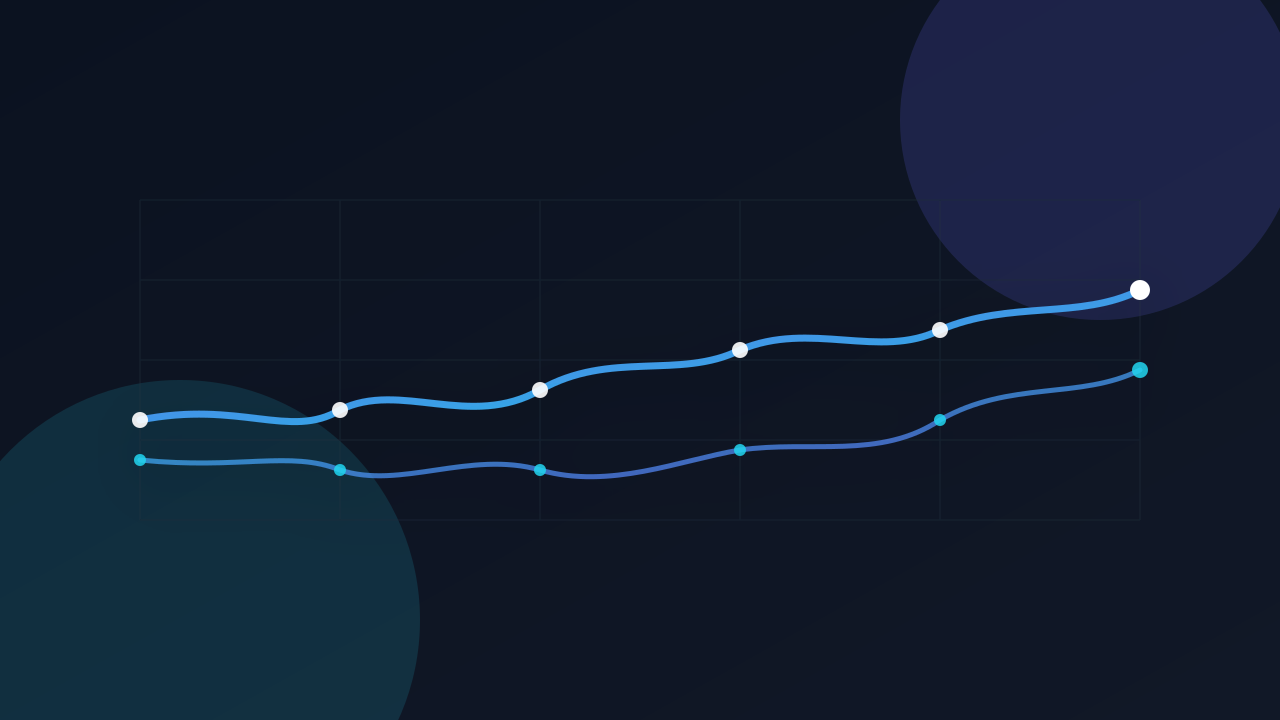
How To Compare Blood Tests Over Time
A single blood test is a snapshot. It captures what your body looked like on one morning, after one night of sleep, after one specific meal, during one particular week of your life. It is useful, but it is incomplete. The real story of your health is not written in a single result — it is written in how those numbers move, settle, drift, and recover across months and years.
Learning how to compare blood tests over time is one of the most underrated skills in personal health. It is also one of the most difficult, because almost everything around blood testing is designed for the single visit: the printout, the reference range, the brief conversation with a clinician. Once you walk out of the lab, your results scatter into PDFs, portals, emails, and folders that rarely talk to each other.
This guide is about putting those scattered moments back together. It explains why trends matter more than single results, why reference ranges can shift between labs and across years, what to actually look at when you place two reports side by side, and how to start building a personal health timeline you can actually understand.
It is not medical advice. It will not tell you what is "optimal" or hand you a diagnosis. It will help you think more clearly about your own data, ask better questions, and notice patterns that no single report could ever reveal on its own.
Why Most People Never Compare Their Blood Tests
Most people have had several blood tests over their adult life. Few have ever compared them.
The reasons are practical, not philosophical. Results from a check-up two years ago live in an old email. Results from a different clinic live in a portal you no longer remember the password to. A printed copy is somewhere in a drawer. A specialist visit produced a PDF with a different layout, different units, and different reference ranges than the one before it.
By the time the next test arrives, the previous ones are effectively invisible. The new report is read in isolation, judged against its own reference range, and filed away to repeat the cycle.
This is not a personal failing. It is how the system is built. Blood tests are ordered for a moment in time — a symptom, a check-up, a follow-up — and the infrastructure around them ends at that moment. There is rarely a default place where your results live together, sorted, aligned, and ready to compare.
The result is that many people carry years of useful information about their own body and never get to see it as a single picture.
Why One Blood Test Is Only A Snapshot
A blood test measures what is happening in your blood at the moment the sample is drawn. That sounds obvious, but it has real consequences.
Biomarkers shift in response to sleep, hydration, stress, recent meals, exercise, illness, menstrual cycle, medications, supplements, time of day, season, and dozens of other small influences. A single morning blood draw captures all of those at once, then freezes them on a page.
That is why a result inside a reference range does not always mean "nothing to look at," and a result slightly outside a range does not always mean "something is wrong." Both interpretations can be true — but they can only be made carefully when you know the context around the test.
A snapshot tells you what was measured. It does not tell you whether that value is your normal, whether it has been rising for years, whether it has been stable for a decade, or whether it just bounced back from a temporary low. None of that is visible in a single report.
This is why even excellent clinicians are cautious about acting on one number. The number is a beginning, not a conclusion.
Why Trends Matter More Than Single Results
If a snapshot is a single frame, a trend is the film.
Consider a marker like ferritin. A single value of 35 µg/L might sit comfortably inside a lab's reference range. But if your ferritin was 120 two years ago, 80 last year, and 35 now, the trajectory is the story — not the latest number on its own. The reverse can also be true: a result that looks low today might be a steady recovery from something much lower last year.
The same logic applies to almost every routine biomarker. Cholesterol, HbA1c, vitamin D, thyroid markers, testosterone, CRP, liver enzymes, and kidney function all gain meaning when you see them move over time.
Trends matter because the body does not change in single jumps. It drifts. Small, sustained shifts over years are often more informative than a one-off spike or dip. A trend can show:
- A marker that has been quietly drifting in one direction for a long time
- A marker that fluctuates within a stable personal range
- A marker that recently changed after a clear event (illness, new medication, life change)
- A marker that is recovering toward where it used to be
None of those patterns can be read from a single report. All of them become visible the moment you place two or three reports next to each other in the same place.
Common Challenges When Comparing Blood Tests
Comparing blood tests over time sounds simple. In practice, it is full of small friction.
Different formats. Each lab uses its own layout, naming, and ordering. The same marker can appear as "HDL-C," "HDL cholesterol," or just "HDL" across three reports.
Different units. Cholesterol can be reported in mmol/L or mg/dL. Glucose, vitamin D, ferritin, testosterone — all have multiple common units. A number that looks higher might just be the same value in a different unit.
Different reference ranges. Two labs can analyze the same sample and give slightly different ranges, because ranges depend on the population the lab uses to define them and on the specific assay method.
Missing context. Older reports rarely mention whether you were fasted, on which medications, or how you felt that week. Without context, two similar numbers can mean very different things.
Scattered storage. Results live in patient portals, emails, downloaded PDFs, paper copies, and photos taken on a phone. There is no single shelf where they all sit.
Time gaps. Some markers were measured in one year and not the next. Others were ordered once and never again. A trend needs at least two points, and ideally more.
None of these are reasons to give up on comparing. They are reasons to be patient and methodical. Even a partial comparison — two reports, three or four shared markers — is often enough to start seeing the shape of your own data.
Why Reference Ranges Change
It surprises people the first time they notice it: the reference range next to a marker is not a universal constant. It can be different at different labs, and it can change at the same lab over time.
A reference range is usually derived from a large group of people considered "normal" by that lab's definition. If the population changes, or if the assay (the chemical method used to measure a marker) changes, the range can shift.
This matters when comparing tests because a result of, say, 4.2 might be flagged as "high" by one lab and "normal" by another, even though the underlying value is identical. The biology has not changed. The yardstick has.
When you compare results across years, always check:
- The unit the marker is reported in
- The reference range printed on each report
- Any small notes about assay or method changes
If the units match and the ranges are similar, you can usually compare the numbers directly. If units differ, convert carefully or compare each result to its own range. The goal is not to chase the perfect comparison, but to avoid being misled by something cosmetic.
Why Biomarkers Change Naturally Over Time
Even in a healthy person, biomarkers change. Some shifts are daily, some are seasonal, and some unfold across years.
Daily and weekly shifts. Cortisol, testosterone, and many hormones follow a daily rhythm. Inflammatory markers like CRP can rise temporarily after a hard workout or a minor infection. Hydration changes can move kidney markers.
Seasonal shifts. Vitamin D often drops in winter and recovers in summer, especially in higher latitudes. Activity levels and diet shift with the seasons, and so do some markers.
Life-stage shifts. Pregnancy, menopause, puberty, and aging all change baseline values. A value that was typical at 25 may not be typical at 55, and that is not necessarily a problem — it is biology moving through stages.
Long-term drift. Some markers tend to drift slowly across decades. Tracking that drift early, while it is still small, is far more useful than waiting until it becomes large enough to flag on a single report.
Understanding that fluctuation is normal does two things. It stops you from over-reacting to a single change, and it helps you notice when a change is unusual for you — which is often more meaningful than whether it is unusual for a generic population.
How To Compare Blood Tests Properly
Comparing blood tests properly is less about math and more about method. A simple, repeatable approach works better than a complicated one.
1. Gather every report you can find. Old emails, patient portals, printed copies, photos on your phone. Even partial reports help. Put everything in one place — a folder, a cloud drive, or a dedicated app like BodySynk that organizes them automatically.
2. Align the markers. Pick the biomarkers that appear in most of your reports. These become your shared backbone — the markers you can actually trend.
3. Check units and ranges. For each marker, confirm the unit is the same across reports. Note the reference range printed on each report so you can see whether the range itself shifted.
4. Order results chronologically. A simple table or list with date, value, unit, and reference range is enough. Do not worry about charts at this stage. Clarity beats decoration.
5. Look for direction, not perfection. Ask: is this marker stable, drifting up, drifting down, or fluctuating? You do not need a precise slope. You need a sense of direction.
6. Add context where you can. Note anything that might have influenced a result — a known illness around the time of the test, a new medication, a change in routine. Context is what turns a number into information.
7. Bring it to your clinician. Comparing on your own is for understanding. Acting on it — changing medication, ordering follow-up tests, ruling things in or out — is a conversation with a qualified professional, who will have crucial context you do not.
That is the whole method. Gather, align, check, order, observe, contextualize, discuss. It scales from two reports to twenty.
If you want a closer look at reading a single report well before you start trending, see how to read blood test results, how to understand blood test results, and how to interpret lab results.
Which Biomarkers Are Most Useful To Track
You do not need to track everything. A small set of well-chosen markers, measured consistently, is far more useful than a sprawling panel done once.
A practical starting set for most adults includes:
- Complete blood count — hemoglobin, white cells, platelets. A general baseline of how blood is being produced.
- Ferritin — iron stores. Especially useful for anyone with fatigue, heavy periods, or vegetarian/vegan diets.
- Lipid panel — total cholesterol, HDL, LDL, triglycerides. Cardiovascular context that benefits from years of data.
- HbA1c — average blood sugar over the past few months.
- Vitamin D — strongly seasonal; a trend across years tells you more than any single result.
- Thyroid markers — TSH at minimum, with free T4 when useful.
- Testosterone (where relevant) — total and, where ordered, free testosterone.
- CRP — a general marker of inflammation. Especially informative as a trend rather than a single value.
- Liver function — ALT, AST, ALP, GGT, bilirubin.
- Kidney function — creatinine, eGFR, urea.
What makes these markers powerful is not any single result. It is the fact that they are common enough to appear in most routine panels, which means you are likely to have several years of data on them already, even if it is currently scattered.
You can add more specific markers depending on your situation and your clinician's advice. But this core set is enough to start seeing the outline of your own long-term health.
Creating A Personal Health Timeline
A personal health timeline is exactly what it sounds like: a chronological view of your health information, with blood tests at the center and other context layered around them.
It does not need to be elaborate. The basic version is:
- Dates of every blood test you have on file
- Values for a handful of consistent markers at each date
- The reference ranges printed on those reports
- Brief notes about what was happening in your life around each test
That alone, written into a simple document, transforms how you see your own data. Suddenly the gaps become visible. The patterns start to stand out. You can see that your vitamin D drops every winter, that your ferritin has been creeping down for three years, that your CRP spiked once around an illness and then returned to normal.
A timeline does three things a stack of reports cannot:
- It shows continuity. Your health is one continuous story, not a series of unrelated appointments.
- It surfaces direction. Even rough lines through three or four points show you which way a marker is moving.
- It preserves context. Notes about life events, medications, or symptoms attach meaning to numbers that would otherwise float free.
You can build a timeline manually in a spreadsheet. You can also use tools designed for it. Tracking your health data in one place is the broader version of this same idea — a single, continuous record across years, instead of dozens of disconnected files.
Understanding Long-Term Health Patterns
Long-term patterns are different from short-term changes. They unfold quietly, often without symptoms, and they are easy to miss without a timeline.
Some common patterns worth knowing about:
Slow drift. A marker moves in one direction over years, often staying inside the reference range until late. Cholesterol, fasting glucose, blood pressure, and kidney markers can all drift this way. Catching the drift early gives you and your clinician far more options than catching it late.
Stable personal baseline. Some people have a marker that sits at the edge of a reference range and stays there for years. The number looks alarming on a single report and entirely unremarkable across ten. Knowing your personal baseline is one of the most useful outputs of a timeline.
Recovery curves. After an illness, a deficiency, a pregnancy, a course of medication, or a period of high stress, markers often recover gradually. Seeing the curve is reassuring in a way that a single mid-recovery result is not.
Cycles. Seasonal markers like vitamin D, or hormonal markers that vary across a menstrual cycle or with age, form repeating shapes over time. Cycles are easy to misread as random fluctuation when you only see one frame.
Step changes. Sometimes a marker shifts to a new level and stays there — after starting a new medication, changing diet, or going through a major life event. A step change is meaningful in a different way than a slow drift.
You do not need to identify the pattern yourself. You only need enough organized history to recognize that there is a pattern, and to bring it to someone qualified to interpret it with you.
Questions To Ask About Changes In Your Results
When you notice a change between two reports, a few questions help you think clearly before reacting.
- How big is the change relative to the reference range? A small movement well inside the range is usually less interesting than a movement that crosses a boundary.
- Is it part of a longer trend, or a single jump? One data point in a different direction is rarely a trend on its own.
- What was different around each test? Time of day, fasting status, recent illness, new medication, supplements, a stressful period, a hard training block.
- Did the lab or assay change? A different lab can produce slightly different numbers for the same biology.
- Is the change consistent across related markers? A change in one marker that is mirrored in related markers is more informative than an isolated movement.
- What would my clinician want to know? Prepare a short summary: the marker, the values, the dates, the ranges, anything you noticed. That makes the conversation much more productive.
These questions are not about self-diagnosis. They are about replacing alarm or dismissal with a calmer, more grounded reading.
Comparing Tests From Different Labs
Different labs can give slightly different results for the same sample. This is not a flaw — it reflects real differences in equipment, reagents, and methods. The differences are usually small, but they are real, and they matter when you are comparing.
A few practical habits help:
- Where possible, use the same lab over time for markers you care about.
- When labs differ, compare each result to its own reference range rather than to the other lab's number directly.
- Note the assay or method if the report lists it, especially for hormones, thyroid markers, and vitamin D, where method differences are more noticeable.
- Treat small differences between labs as noise rather than signal unless they are consistent across multiple tests.
You can still build a meaningful timeline across labs. You just hold the comparisons a little more loosely and pay more attention to direction than to exact values.
Comparing Tests From Different Years
Comparing results from different years adds another layer: time itself changes the body.
Reference ranges may have shifted. Your own baselines may have moved as you aged. Lifestyle factors — sleep, work, training, diet, stress — may have changed in ways you have half-forgotten. Medications may have started or stopped.
When working with multi-year data, prioritize:
- Consistency of marker, unit, and lab wherever possible.
- A handful of well-tracked markers rather than a wide net.
- Annotations: even a one-line note per year about big life changes preserves enormous context.
- Honest gaps: missing years are fine. A trend with gaps is still a trend.
The point is not to reconstruct a perfect record. It is to give yourself and your clinician a clearer view of the long arc of your health than either of you would otherwise have.
Why Context Matters
Context is what turns a number into information. The same value can mean different things in different settings:
- A higher CRP during a known infection is expected. The same value with no obvious trigger is a different conversation.
- A lower ferritin during pregnancy is common. The same value in a different season of life carries different weight.
- A change in liver enzymes shortly after starting a new medication may be related to that medication. The same change with no recent changes is something else entirely.
Without context, results are easy to misread in both directions — alarming when they should be unremarkable, or unremarkable when they should be flagged. A timeline preserves context. A stack of unconnected reports usually loses it.
Why Age Affects Interpretation
Many reference ranges are derived from broad adult populations, but the body does not stay still across decades.
- Kidney function (eGFR) tends to decline gently with age.
- Cholesterol patterns shift with hormonal changes, including menopause.
- Bone, muscle, and metabolic markers move across life stages.
- Hormones change in well-known patterns through puberty, adulthood, perimenopause, and later life.
Interpreting a result without considering age — and without comparing it to your own younger baseline — is like reading a sentence without the paragraph around it. A timeline that spans years naturally encodes age, which is why long-term comparison is so much more informative than a single snapshot.
Why Trends Can Reveal Things Single Tests Cannot
Single tests can flag obvious extremes. Trends reveal everything in between.
A trend can show:
- That a marker has been moving for years before crossing any threshold.
- That a marker that looks abnormal once is actually your stable baseline.
- That a recent change is part of a recovery rather than a decline.
- That two markers move together in a way that hints at a larger pattern.
- That a lifestyle change is showing up in your blood, even if subtle.
None of these are diagnoses. All of them are better questions to bring to a clinician than "is this one number okay?" Trends do not replace medical interpretation. They make medical interpretation possible at a depth that single reports cannot reach.
How Longitudinal Health Tracking Works
Longitudinal tracking simply means following the same things across time, in a structured way, so you can see how they change.
In practice, that looks like:
- A consistent place where all your reports live.
- A consistent set of markers you pay closest attention to.
- A consistent rhythm — annual check-ups, or whatever cadence you and your clinician agree on.
- A consistent record of context: medications, major life events, symptoms when they are relevant.
Once those four things are in place, comparison stops being a project and becomes a habit. New results slot into an existing picture instead of starting from zero each time.
This is the underlying idea behind BodySynk: not to replace your clinician, not to label markers as "good" or "bad," but to make the long view of your own health possible — in one place, in your own hands.
How BodySynk Helps Organize Blood Test History
BodySynk is designed around the way real health data actually arrives — slowly, in different formats, from different sources, across years.
You can:
- Add blood test reports from any lab, any year, in any common format.
- Keep results, ranges, units, and dates aligned in one place.
- See markers as a continuous timeline rather than as isolated PDFs.
- Add notes for context: medications, symptoms, life events, training blocks, travel, illness.
- Bring a clear, organized summary to your next appointment, instead of a folder of paper.
It is not a diagnosis tool. It is a memory tool — a way for your own health history to stop being scattered across drawers and inboxes and start being something you can actually see.
If you have never had a single place for your health data before, tracking your health data in one place is a useful starting point. From there, blood test comparison becomes a natural extension of the same habit.
FAQ
How do I compare blood tests from different years? Gather every report you can find, align the markers that appear in most of them, check units and reference ranges, and order the values chronologically. Look for direction — stable, rising, falling, fluctuating — rather than chasing exact numbers. Bring meaningful changes to a qualified clinician.
Which biomarkers should I track? A practical core set is complete blood count, ferritin, lipid panel, HbA1c, vitamin D, thyroid markers, testosterone where relevant, CRP, liver function, and kidney function. These appear in most routine panels, which makes trending realistic.
How often should blood tests be compared? Comparison is most useful when you receive a new report. At that point, place it next to your previous ones for the same markers. The cadence of testing itself is a clinical decision; once a year is common for general check-ups, more often when there is something specific being followed.
Can labs use different reference ranges? Yes. Reference ranges depend on the population each lab uses to define them and on the specific assay method. The same value can fall inside one lab's range and just outside another's. Always compare a result to the reference range printed on that specific report.
Why do biomarkers fluctuate? Sleep, hydration, stress, recent meals, exercise, illness, menstrual cycle, medications, supplements, time of day, and season all influence biomarkers. Some movement between tests is normal even when nothing important has changed.
Why are trends important? Trends show direction, baselines, recovery curves, and slow drift that single tests cannot reveal. A value that looks unremarkable today might be the end of a long downward slope; a value that looks worrying might be part of a clear recovery. Trends give context that snapshots cannot.
What is a health timeline? A health timeline is a chronological view of your health information — blood test values at each date, the reference ranges that applied, and brief notes about what was happening in your life. It turns scattered reports into one continuous picture.
How many years of blood tests should I keep? As many as you can. Older reports become more valuable over time, because they extend the length of your trends. Even reports from a decade ago can add useful context. Digital copies are easier to keep than paper.
What should I look for when comparing results? Direction first, magnitude second. Is the marker stable, drifting, or fluctuating? Is the change inside the reference range or crossing it? Is it isolated or mirrored by related markers? Was there a clear event around the test? These questions matter more than any single number.
Why is context important? The same value can mean different things depending on what is happening around the test — illness, medication, life stage, season, recent activity. Without context, both reassurance and alarm can be misplaced. A timeline preserves context; a stack of reports usually loses it.
Do I need an app to compare blood tests? No. A simple spreadsheet works. The point is to have one place where your results live together in chronological order, with units and ranges visible. An app like BodySynk reduces the manual work and keeps everything aligned automatically, but the underlying habit is what matters.
Can comparing blood tests over time replace seeing a clinician? No. Comparison is for understanding and for asking better questions. Diagnosis, treatment, and clinical decisions belong with qualified professionals. A clear, organized history makes those conversations far more productive — it does not replace them.
Conclusion
A single blood test is a moment. A series of blood tests, organized and seen together, is a story.
Comparing blood tests over time is less about chasing perfect numbers and more about giving yourself a clearer view of your own long-term health. It means accepting that snapshots are limited, that trends carry meaning, that context matters, and that small shifts over years often matter more than dramatic single results.
You do not need to be a clinician to build this view. You need a place where your results live together, a handful of markers you follow consistently, and the patience to add to that picture year by year. The questions you bring to your next appointment will be better. The conversations you have about your own health will be richer. And the quiet drift of your own biology will stop being invisible.
That is the kind of long view BodySynk is built to make possible — organized and continuous. The rest is conversation with the people qualified to help you make sense of it.
Related reading
Comparing results is far easier when the underlying records are in order — see how to organise your medical records. If you are still translating a single report, what do my blood test results actually mean is the right place to start.
Start from the top of the topic with the blood tests hub, or read how to read blood test results with a report in front of you.